
By now, most of you have probably seen articles about options and speculative investing, which I highly encourage that you read. Additionally, we also have an article that describes “safe” investing (there is no such thing as 100% safe investing besides purchasing treasuries but even that has a chance of the government screwing you over) which basically entails purchasing index funds. In this article, we’re going to be looking at options as not just a way of hedging, but also speculating. The reason why I don’t use the term “investing” when it comes to options because you’re not really investing in a company; you’re just speculating on how the spread or underlying security is going to do in a specified time frame and hope that it works out for the best. Usually, the time frame is short and it could be a couple of days to even a couple of months. Anyways, enough with the rambling and let’s get started.
So what are options?
Options are contracts that you buy on the market and there are two types of contracts you can buy as a retail investor (I’ll not be covering futures because as non-accredited investors we usually can’t buy these).
- Call: when you buy a call option at a specified strike price, you are essentially buying a right to purchase the underlying security at that strike price. So if you buy ABC call option for $0.36 with a strike price of $10 and an expiration date a week from now, basically it means that between now and the date it expires, you can exercise this contract and you’ll be able to buy ABC stock for $10, even if it’s trading higher than its strike price on the market. If the market price is $20, the option is in-the-money which means that this would be a good deal if you owned the option. Usually, in-the-money options are more expensive than out-of-the-money options, which for a call would mean that the strike price would have to be higher than the market price.
- Put: these options give you the right to sell the underlying security at the strike price anytime between now and the expiration date. For example, when you buy a put option for ABC for $1.24 with a strike price of $10 and an expiration date from a week from now, you can exercise this option and sell ABC for $10 a share before the expiration date. Using the same example from the call option, this put option would be out-of-the-money because it’s market price of $20 is higher than its strike price since it wouldn’t make sense to exercise this option when you could sell for a higher value in the market. An in-the-money put option would have a strike price of $20 or higher because exercising this option would cause you to sell the stock at a higher price than what it’s currently trading at. Similar to call options, in-the-money puts are more expensive than ones out-of-the-money.
What Drives the Value of Options?
Options are weird creatures in that sometimes the underlying security has no effect on the price of the option. For example, take a look at this garbage company called OPKO Health (“OPKO”, “company”) 😉
To give you a background, OPKO is a therapeutics/pharmaceutical company that manufactures a hormonal drug and sells testing kits for prostate cancer. A fundamental investor would first look at the company and its business model before even looking at its financials but since options are not investing, we frankly don’t give a shit about that. What we care about most for options is volatility, followed by the amount of time left before the option expires and lastly, the direction the underlying stock trades since we’re speculating. There are options strategies that can help mitigate the last attribute where we don’t care which way the stock trades and that’s what we’re going to be looking at for OPKO.
To save us all from the shitshow of pricing options, I’ve used this handy calculator to assemble a relatively risk-free strategy to profit off of this shitty company. Refer to the table below:
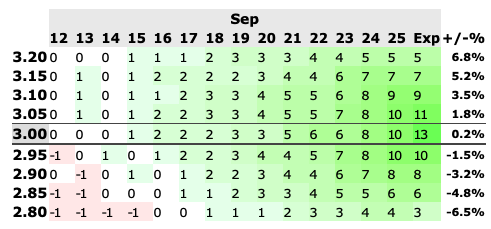
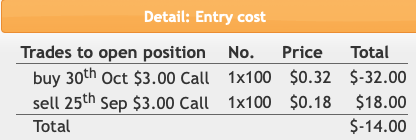
Let’s dissect what this table means. We’ve assembled a 15/30 day calendar spread, which is a neutral strategy (no opinion on which way the stock moves). This spread consists of buying a 30th Oct $3.00 call of $0.32 per option, or $32 total since options trade in multiples of 100 and writing a 25th Sept $3.00 call of $0.18 per option or $18 total which would give us an entry price of $14 (see image below). Note that we’ve bought a call with a closer expiration date and sold a call with a further date.
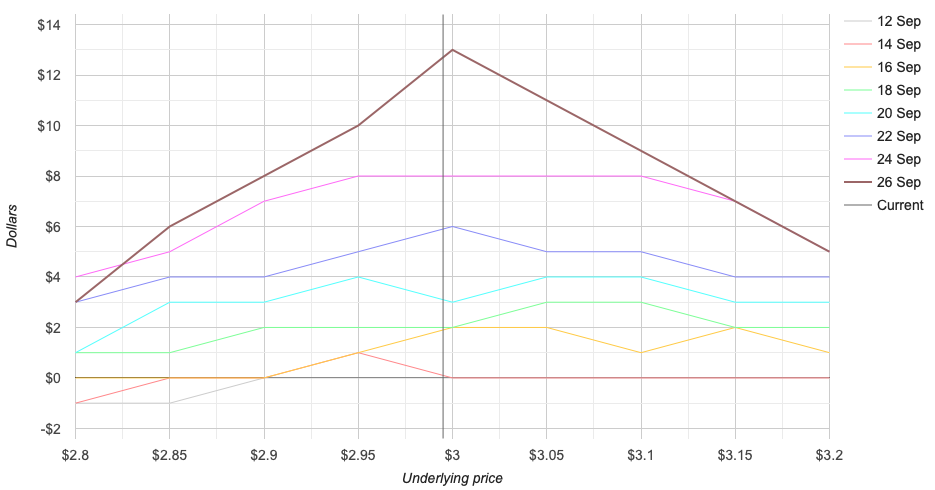
Looking at the profit/loss chart above, we can see that it’s more than likely that we’re going to create a profit. The only time we’d lose money is if the underlying security dips below $3.00 a share in the near-term but if we hold out on our trade, we’ll make a profit in a month no matter how the security trades.
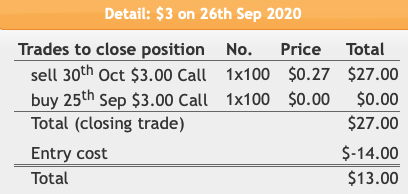
As you can see, we’d essentially be doubling our money from this trade in a month which even beats out some private market returns. Keep in mind trades like this are not common and you’d have to be lucky to find these or at least know what you’re doing.
Now that was a good example of a trade that you should do. Now let’s look at a trade that you shouldn’t do unless if you need to burn money for tax reasons. (will be covered in a different article)
Using the same company, OPKO, let’s look at a straddle spread, which is suitable if the underlying stock is volatile.
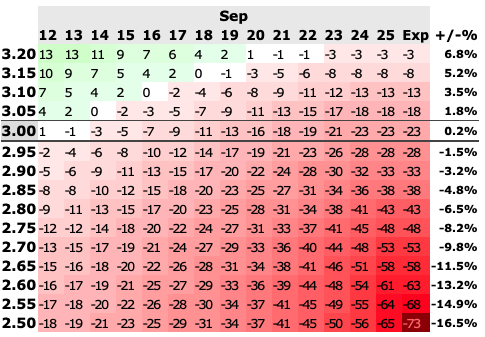
Without even looking at the numbers, notice how much of the table is red compared to the previous table. This shows that there are many more chances to lose money on this trade; at best we’d make $13 profit off of a $73 entry cost or ~1x MOIC or worst case we’d lose a whopping $73 when both expire worthless. To give you a better perspective, let’s look at a graphical version:
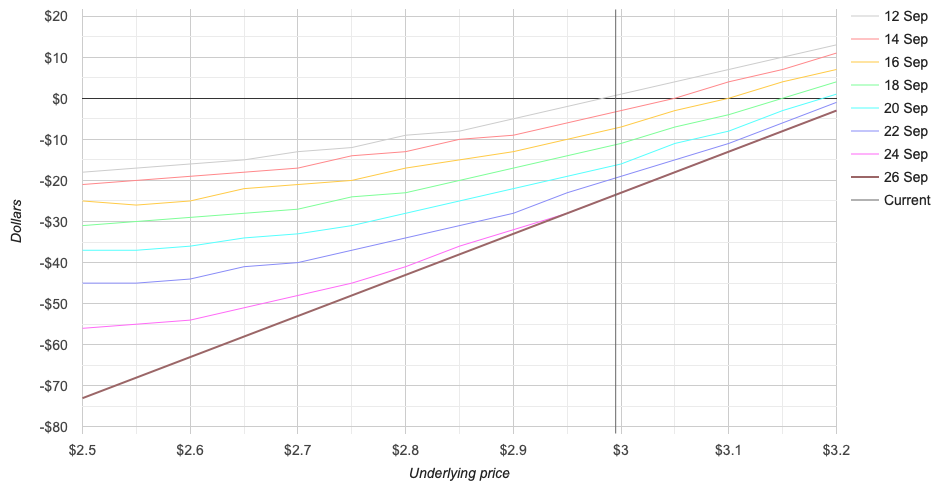
The graph clearly shows that the opportunities to make profit are minimal while the opportunities for losses are maxed out. This would NOT be a good trade even when using probability. Fortunately for us, we’re not dumbasses (at least I hope not :)) so we can simply invert this trade to turn this from unprofitable to profitable. Let’s look at what happens to the profit/loss table and graph when we sell both options for an inverted straddle.
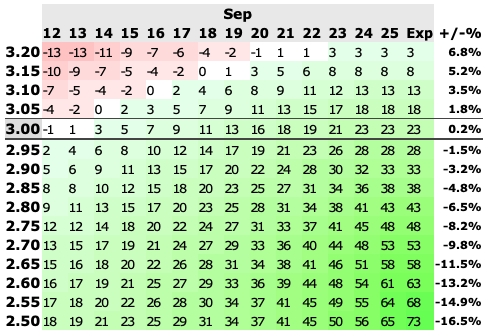
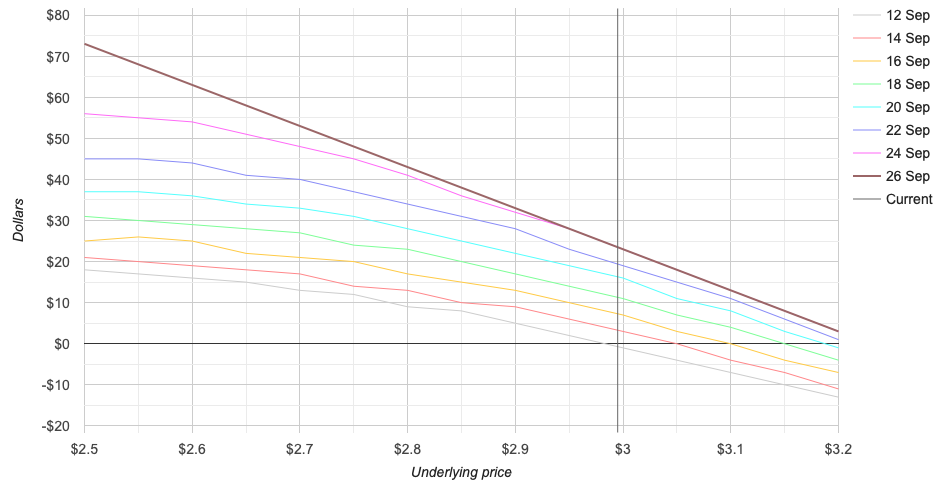
As you can see, there are a lot more green boxes than red which means that the chances of making a profit are higher. Additionally, the graph shows that there are more opportunities to make a profit at differently underlying prices than losses and as long as the underlying price doesn’t go above $3.00, we’d be making a profit.
I hope this has been a helpful primer into options; I’ve also listed below what tools an resources I’ve used. Keep in mind that an options calculator is simply a tool and is not meant to replace your greatest asset, which is your brain. There are many variables that go into option pricing and just because the options calculator checks out doesn’t mean that you should automatically buy. Feel free to experiment with options but do be prepared to lose that entire amount since options trading is not investing, but speculating. Feel free to leave a comment if you have a question or if you’d like to offer your own tips and tricks 🙂
Resources: